MACRO ECONOMIC TRENDS 17th AUG 2025
- Aug 17, 2025
- Placement Booster
\

Global Macroeconomic Update
US Economy: Key Highlights
- Gen AI–driven investment in information technology was the major engine for US GDP growth, accounting for 59% of expansion in the first half of 2025. Q2 GDP grew at 3% annualised, largely due to a record fall in imports while domestic demand remained moderate.
- Labour market conditions softened: unemployment rose to 4.2% in July, with job gains sharply slowing (only 73,000—entirely in healthcare/social assistance), but wage growth remained robust (3.9% year-over-year), supported by labour scarcity following a decline in immigration.
- The US Federal Reserve is expected to begin cutting rates in September (with a 98% probability), with markets anticipating multiple cuts by year-end, reflecting concerns about a slowing economy.
- Tariffs: The average US tariff rate reached 18%, the highest in nearly a century. While businesses and exporters have absorbed much of the cost, price increases are expected soon. These tariffs are forecast to add around 2 percentage points to US inflation in the coming year and generate ~$600 billion/year (about 2.1% of GDP) for the government.
- Macro market effects: Softer labour data and inflation concerns have led to declines in US equities, a weaker US dollar, and falling Treasury bond yields.

Global Inflation and Monetary Policy
US Inflation
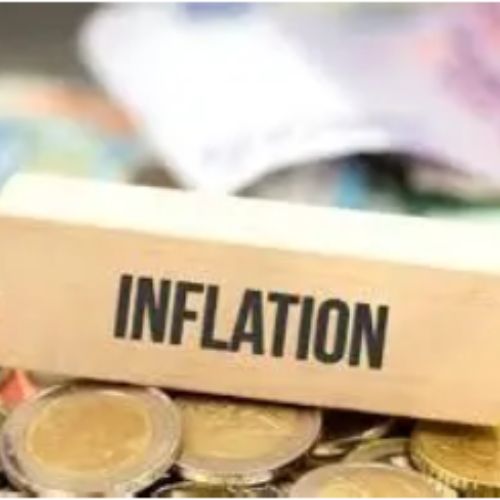
- Consumer price inflation was 2.7% year-over-year in July, in line with forecasts, while core inflation rose to 3.1%.
- Price pressures persist from rising wages, labour shortages, import tariffs, and a weaker dollar. Durable goods prices, which typically fall, have instead begun climbing—the biggest such reversal since mid-2022. Deloitte and S&P Global both note that persistent wage gains, in tandem with tariffs, are sustaining higher headline and core inflation, raising questions about the Fed’s balancing of its dual mandate going forward.
Other Major Economies
- Japan: Wholesale inflation (CGPI) slowed for a fourth consecutive month to 2.6% year-over-year in July (from 2.9% in June); yen-based import prices plunged 10.4%, reducing imported inflation pressures. The Bank of Japan highlights that upstream cost pressures are receding, lessening any urgency to tighten policy.
- China: The Producer Price Index fell 3.6% year-over-year in July, the same as June and worse than forecast, extending nearly two years of factory-gate deflation, reflecting persistently weak domestic demand, global trade uncertainty, and property sector difficulties. The Consumer Price Index was flat year-over-year in July (compared to a 0.1% rise in June), and food prices contracted further. While core CPI improved to +0.8% (a 17-month high), deflationary risks remain pronounced.
- Eurozone: Price gains remain subdued with core inflation below target; the European Central Bank continued its rate pause at 2%, citing uncertainty around trade and tariffs as a key risk factor.
- Australia: Inflation hit a four-year low of 2.1% in Q2, with broad disinflation across sectors except housing. The Reserve Bank is expected to cut its policy rate to 3.60% (economists forecast more easing later in 2025).
- Thailand: Negative inflation has persisted for four months; weak domestic demand and falling global goods prices have pushed the Bank of Thailand closer to a rate cut to 1.75%.
- Russia: Inflation remains historically low even as growth decelerates
Emerging Market Policy Divergence
- Unlike developed peers (Fed, ECB, BOJ), several emerging-market (EM) central banks actively cut rates in July to support economic recovery amid trade dislocations and capital outflows. This underscores a widening policy split as EMs prioritise growth and liquidity while advanced economies remain vigilant over persistent inflation threats.

Global Trade, Tariffs, and Geopolitical Dynamics
US–EU Trade Deal
- Averted a full-scale trade war but codified historically high tariffs: the US will apply a 15% rate on most EU imports (pharmaceuticals, semiconductors, and automobiles). This was lower than the threatened 30% but well above the previous 10%.
- For EU automakers, the new tariff is lower than the 27.5% previously imposed, offering some relief. US steel and aluminium imports from the EU remain subject to a 50% duty.
- The EU pledged $750 billion in US energy purchases over three years, tripling levels from 2024, and $600 billion in new US investments, though execution details remain ambiguous.
- Tariffs on €70 billion in trade (aircraft, semiconductors, some agri-products) are to be reduced to zero, pending final details. EU authorities and business leaders largely welcomed the agreement for avoiding a worse outcome but voiced concerns over lost competitiveness.

Country Tariffs
- India faces a new 25% tariff, with US officials citing deepening India-Russia commercial ties (notably energy and defence imports) as justification.
- A 35% US tariff was applied to Canadian imports, exempting USMCA-covered goods; the deal’s 2026 reappraisal raises more North American trade uncertainty.
- Switzerland was hit with a surprise 39% tariff, causing outcry as pharma exporters now compete at a disadvantage to European Union rivals.
- Taiwan is subject to a 20% tariff; Southeast Asian countries (Malaysia, Thailand, Cambodia) bear rates of 19%, while Laos and Myanmar face a steep 40% levy. Goods routed via China may also incur 40% tariffs.
- Australia, Japan, South Korea, and the UK see moderate tariffs (10–15%), though negotiations and possible adjustments are ongoing.
- Many nations are actively lobbying for exemptions as US tariff policy continues to adjust in response to political, diplomatic, and court pressures.
Supply Chains
- Multinational companies are delaying major investment and restructuring plans due to uncertainty about the permanence and structure of US and global tariffs.
- Trade and supply chain instability is especially acute for advanced manufacturing sectors and exporters reliant on US or EU market access; legal challenges to the current tariff regime could lead to further disruption or change in global trading patterns

Currency and Financial Markets
Currencies
- The dollar index (DXY) declined to 97.81, the weakest reading since July 28, as markets priced in imminent rate cuts. The euro advanced to $1.1705, the pound to $1.2734, and the yen strengthened.
Markets
- Global equities rallied to record highs, with the MSCI All Country World Index at 950.13, S&P 500 E-minis up after July inflation data, and Japan’s Nikkei and German DAX both notching new peaks.
- US equity and fixed income markets exhibited heightened sensitivity to macro data, dovish central bank commentary, and headline risk around tariffs and employment; volatility spiked after July’s weak jobs figures.

Policy Expectations
- Markets substantially repriced the outlook for monetary easing: multiple Fed cuts are now expected by year-end; similar policy paths are anticipated for Australia and Thailand, while the ECB and BOJ remain more cautious on further easing.
Regional Economic Developments
Europe & Eurozone
- Eurozone business sentiment marginally improved (composite PMI 50.9 in July, services PMI 51.0), though export sales contracted for the 41st consecutive month. Germany eked out modest growth; France’s activity contracted.
- The ECB maintained policy rates, noting uneven recovery and downside risks from both energy imports and trade strains with the US.
Asia-Pacific
- Australia: Unemployment reached a 3.5-year high (4.3%), investment cooled, and economists widely expect the RBA to ease further to cushion slowing activity.
- Thailand: Confronts negative inflation, declining private consumption (-0.3% m/m), a 5% fall in exports, and ongoing softness that prompted expectations of a 25 bp rate cut.
- Japan: Revised its fiscal year growth forecast down to 0.8% (from 1.2%), citing US tariff impacts and weakening domestic consumption. While the BOJ is monitoring inflation closely, cooling wholesale prices this summer have reduced pressure for an immediate policy shift.
- China: Factory-gate prices fell for a 17th consecutive month and CPI was flat year-over-year, signalling persistent deflation. Authorities have pledged to crack down on price wars, but analysts remain concerned over the weak backdrop in domestic demand and real estate.

Africa
- South Africa: The unemployment rate (Q2: 33.2%) rose for a second quarter in a row, leaving 8.4 million out of work. Youth unemployment remained stuck at 46%. These figures present a significant challenge for South Africa’s coalition government, which has made job creation a central priority.
Russia & Emerging Markets
- Russia’s Q2 GDP growth slowed to 1.1% (from over 4% a year earlier), prompting official forecasts to be revised down.
- The IMF raised its 2025 emerging-market growth outlook to 4.1% from 3.7%, citing a stronger-than-expected first half for China as well as some relief from reduced US-China tariffs.
Sectoral Highlights
Tech & Gen AI
- Heavy investment in Gen AI infrastructure is the dominant story in US and, increasingly, global tech markets, with related IT spending accounting for well over half of US GDP growth in early 2025.

- The “Magnificent Seven” US tech firms produced roughly half of the S&P 500’s 2024 rise. Despite the market enthusiasm, analysts have drawn parallels to the early-2000s dot-com bubble and warn that a market correction remains a risk if Gen AI investment fails to deliver productivity gains or is undermined by tariff-induced slowdowns.
- Data centre growth is fueling a surge in electricity demand; the IEA predicts that US data centres will account for almost half of the country’s electricity demand growth by 2030, with global data centre demand set to double to match the entire electricity consumption of Japan.
Energy & Commodities
- The IEA forecasts global oil supply to rise 2.2 million barrels per day in 2025, while demand is seen growing by only 680,000 bpd. This points to a market that is likely to be oversupplied, with OPEC+ output hikes potentially leaving global supply 1.3 million bpd above demand by next year.
- Brent crude prices remained below $66 per barrel amid market pessimism, despite supply-side adjustments.
Manufacturing & Construction
- Global manufacturing faces mixed fortunes: in the US, advanced durable goods have proved more resilient, while investment in traditional manufacturing and construction weakened, especially in regions hit by tariff uncertainty.
- Across Europe and Asia, manufacturing output has come under strain from weak demand, persistent trade disruptions, and a retreat in new capital expenditures.


Indian Macroeconomic Update
Growth and Economic Activity
- GDP & Growth Momentum
- India’s economy showed resilience in the face of global headwinds and US tariff pressure during the period. Domestic drivers, especially IT/AI-linked investment and construction, helped offset some of the export drag.
- India’s manufacturing PMI rose to a 16-month high of 59.1 in July, indicating robust output and strong domestic demand. However, business optimism dropped to a three-year low, and hiring slowed, reflecting concern over competition and inflation.
- Services sector activity surged in July, with the Services PMI at 60.5—its strongest in 11 months—driven by both domestic and export orders. This sector continues to be a cornerstone for growth even as global demand wavers.
- Underlying Weaknesses
- Despite strong macro numbers, business sentiment is cautious given tariff uncertainty, global slowdown risk, and patchy private capex outside public-led projects.
Employment and Labour Market
- Headline Trends
- India’s unemployment rate was steady at 5.6% in June (rural: 4.9%; urban: 7.1%). While total employment rose (to 64.33 crore in FY24 from 47.5 crore in FY18), youth unemployment (15-29 years) remains elevated at 13.8% (rural) and 18.8% (urban).
- Sectoral Employment
- Labour market resilience in rural areas owes much to agriculture and government schemes, while urban job creation lags as IT/tech export uncertainty clouds the outlook.

Inflation & Price Trends
- Consumer Inflation
- Headline CPI inflation dropped to 1.55% in July, the lowest since 2017 and its ninth consecutive monthly fall, thanks largely to declining food prices.
- Wholesale Prices
- WPI inflation drifted into negative territory at -0.1% in June (20-month low), confirming broad-based disinflation in key inputs and fuel.
- Policy Implications
- The RBI revised its inflation forecast for FY25 down to 3.1%, signifying room for continued accommodative policy, though falling output prices hurt farmer incomes.

Monetary Policy and RBI Stance
- Policy Rate
- RBI kept the repo rate unchanged at 5.50% in August, following a June rate cut. The central bank emphasised that further moves are data-dependent and flagged US tariffs as a significant risk to the inflation and growth outlook.
- Liquidity and Interventions
- RBI has intervened heavily in FX markets (over $9 billion reserve depletion in early August) to stabilise the rupee amid tariff and capital flow strains.
External Sector and Trade
- Trade Performance
- Indian merchandise exports were flat at $35.14 billion in June, while the trade deficit narrowed 6.2% y-o-y to $18.8 billion, helped by lower imports and tariff-related demand pull-forward.
- Current account deficit for Q2 FY25 stood at $11.2 billion (1.2% of GDP), a manageable level but reflecting pressure from higher tariffs and external demand risk.
- Tariff Disruption
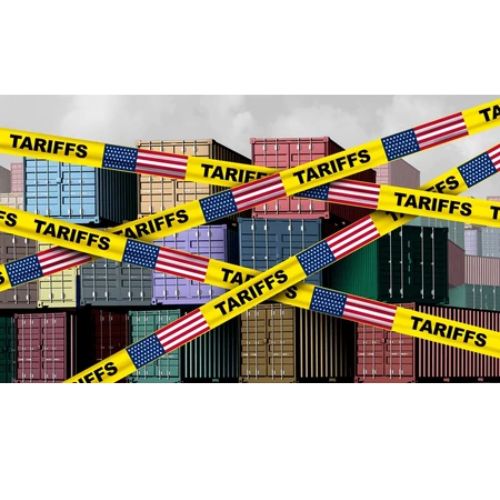
- US tariffs on Indian exports rose to 50% (from an initial 25%), covering over half of India’s exports to the US and hitting sectors like textiles, automotive, and pharmaceuticals. The estimated risk exposure is $40 billion in annual exports.
- Moody’s estimates that tariffs could shave 0.3 percentage points off India’s expected GDP growth, undermining the country’s “manufacturing push” at a critical phase.
- Foreign Exchange & Rupee
- Forex reserves fell to $688.9 billion by August 1 due to the central bank’s rupee defence. The rupee, however, posted its best monthly performance in over a year due to FX market interventions and a softer dollar.
- Ongoing Bilateral Talks
- Despite tariff escalation, trade negotiations with the US continue, with a US delegation expected in New Delhi and India remaining firm on protecting agriculture, dairy, and other priority sectors.
Fiscal Position and Public Spending
- Deficit and Capex
- Centre’s fiscal deficit for FY25 is projected at 4.8% of GDP (down from 4.9% budgeted), with a target of 4.4% for FY26.
- Government is continuing its infrastructure-led growth push, budgeting ₹11.21 lakh crore (3.1% of GDP) for FY26 capex. However, public sector capex slipped by 23% y-o-y in July (high base effect), and tariff uncertainty weighed on private investment.
- Public Investments
- Notably, the government announced a fresh ₹47,000 crore investment in BSNL’s telecom network upgrade and expansion—a signal of policy focus on digital infrastructure despite external trade risks.
Sectoral Performance
- Services
- The services sector (PMI 60.5) saw the fastest expansion in nearly a year; strong demand was observed both domestically and in export markets, with new business from Asia, Canada, Europe, the UAE, and US driving growth.
- Manufacturing
- Factory output growth remains robust (PMI 59.1), but sentiment and hiring are turning cautious due to global demand risks and inflation fears.
- Steel
- India became a net steel exporter again after two years, with imports falling 40%, in part due to global and US tariff barriers, but value-added export prospects remain under pressure.
Sources
- US Labor Market Cracks Widen as Job Growth Hits Stall Speed
- US Inflation Rises in July, in Line with Expectations
- Investors Double Down on September Fed Cut After CPI
- Fed Officials Tilt Dovish as US Job Market Softens
- Dollar Extends Weakness as Fed Rate Cut Anticipation Mounts
- Indian Rupee Rises Most in a Month on Dollar Weakness
- World Shares Hit Record as Rate Cut Hopes Buoy Sentiment
- RBA Set to Cut Rates by 25 bps to 3.60%
- Bank of Thailand Set to Cut Rates on August 13
- BOJ Debated Resuming Rate Hikes – July Summary
- ECB Leaves Interest Rates Unchanged Amid Tariff Uncertainty
- Euro Zone Business Growth Inched Up in July
- Japan Cuts Growth Forecast on US Tariffs, Weaker Consumption
- World Oil Market More ‘Bloated’ After OPEC+ Hike – IEA
- Russia’s GDP Growth Slows to 1.1% in Q2
- IMF Lifts 2025 GDP Emerging Economies Outlook
- Japan’s Wholesale Inflation Slows for 4th Month in July
- South African Jobless Rate Rises, Highlighting Coalition Challenge
- China’s July Factory-Gate Prices Miss Forecast, Deflation Concerns Persist
- EM Central Banks Plough On with Easing in July as Major Peers Linger
- Deloitte Economic Updates
- India’s unemployment rate stays at 5.6% in June 2025 – Economic Times
- Number of employed people in India rose to 64.33 cr in FY24 – Economic Times
- India services sector growth hits 10-month high as demand surges – Economic Times
- Manufacturing gains push India’s flash PMI to 60.7 in July, services dip – Business Standard
- Public capex slips in July: Four key government agencies record 23% y-o-y decline – Times of India
- Union Budget 2025-26: Fiscal deficit broadly in line with expectations – Business Standard
- India’s forex reserves decline sharply by $9.3 billion to $689 billion – Hindu Business Line
- India’s goods exports in June flat at $35.14 billion, trade deficit shrinks – Hindu Business Line
- WPI inflation falls to a 20-month low of -0.1% in June – Economic Times
- Reuters India macro articles and update links
- Moody’s warns US tariffs may hurt India’s manufacturing push, slow growth – Reuters
- India pushes ahead with US trade talks despite tariff hike to 50% – Reuters
- India central bank holds rates as expected, flags US tariff risks – Reuters
- India’s retail inflation slows to 1.55% in July – Reuters
- India consumer inflation slows for ninth straight month – CNBC
- Missed Signals, Lost Deal: How India-US Trade Talks Collapsed – Reuters
- Trump-Modi standoff tests India’s economy – Reuters
- Indian blue-chips post fifth weekly loss as tariffs, foreign outflows bite – Reuters
Get More Insights
Technology Consulting Interview for Experienced Professionals: What Interviewers Actually Evaluate
What interviewers truly assess in technology consulting interviews for experienced professionals.
Read MoreMastering Risk Management: A Guide for MBA Students and Professionals
A practical guide to mastering risk management for MBA students and professionals in business and finance.
Read MoreLeveraging Structured Thinking in Career Transitions
Use structured thinking to navigate career transitions with clarity, confidence, and actionable steps.
Read MoreQUICK LINKS
- Home
- About
- Career Conversations
- Resume Reviews
- Mock Interviews
POLICIES
- Terms & Conditions
- Privacy Policy
- Refund Policy
CONTACT
- +91-81485-89887
- support@gocrackit.com
- #518, Ground Floor, 10th Cross, Mico Layout, BTM 2nd Stage, Bangalore - 560076


