

Discover how AI is reshaping MBA careers, which roles face automation, and what skills professionals need to stay ahead.
Read MorePlacement Booster
- 10th July 2026
- Placement Booster
Global Macroeconomic Update

Growth & The "Twin Forces" Friction
The global economy in H1 2026 is navigating a tug-of-war between two structural macro forces: a deep energy supply-side shock arising from the geopolitical conflict in West Asia, and a productivity-boosting corporate investment cycle in Artificial Intelligence (AI).
- Global GDP (IMF): In its July 2026 update, the IMF trimmed its 2026 global growth forecast to 3.0% (from 3.1% in April), with growth expected to rebound to 3.4% in 2027 — still below the roughly 3.5% average pace seen across 2024–2025. The Fund’s own framing is a “V-shaped” hit: weaker growth this year than its pre-war forecast, followed by a rebound, with AI and technology demand offsetting a sharp drop in energy supply from the war better than initially feared. The updated forecast assumes the Strait of Hormuz begins reopening in mid-July and normalises to pre-war traffic by March 2027, on an average oil price assumption of $89/barrel — a working assumption that is already being tested by the July 8–9 ceasefire collapse (see note below).
- Global Inflation (IMF): The IMF raised its 2026 headline inflation forecast by 0.3 percentage points to 4.7%, easing to 3.9% in 2027. Energy prices were running about 25% higher than pre-war levels (the war began February 28, 2026) and were expected to stay elevated. IMF officials flagged that a renewed escalation — exactly what has since happened — could reignite commodity volatility, tighten financial conditions, and de-anchor inflation expectations, since many countries had already drawn down strategic oil reserves built up during the earlier phase of the conflict
- Global GDP (World Bank): Factoring in tight global borrowing conditions and escalating regional hostilities, the World Bank’s mid-year Global Economic Prospects report puts global growth at a more conservative 2.5% for 2026 — the slowest non-pandemic expansion in over a decade.
- Global Trade Volume: Set to slow to roughly 3.5% in 2026 (from about 5.0% in 2025, a year marked by heavy front-loading ahead of U.S. tariffs), driven by shipping disruption around the Strait of Hormuz, before rebounding to 4.3% in 2027.
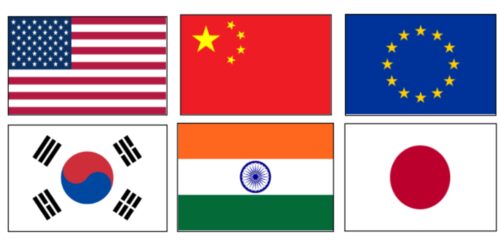
Key Regional Breakdown
- United States: GDP growth is projected at 2.3% for 2026 (unchanged from April), staying at 2.2% in 2027. Corporate capital expenditure on AI hardware and software has provided a cushion against softer global demand, even as the overall U.S. trade deficit widened sharply in May 2026 — up 42.2% month-on-month to $77.6 billion, the highest level in 14 months, with the goods deficit alone up 28.4% to $106.5 billion. Imports rose 3.3% to $395.3 billion while exports fell 3.2% to $317.7 billion, partly on a strong dollar. Capital goods imports hit a record $128.0 billion, driven by computer accessories and semiconductors as the AI buildout continues, though inflation-adjusted capital goods imports actually fell month-on-month — a sign the real investment impulse may be softer than the nominal number suggests. The Atlanta Fed’s GDPNow model was tracking a Q2 growth rate of just 1.4% annualised (down from 2.1% in Q1) partly on this trade drag, with one estimate suggesting the wider trade gap alone could subtract roughly 1.7 percentage points from Q2 GDP. On the flip side, petroleum exports hit a record $38.4 billion as the U.S. benefited from war-driven demand as a net oil exporter.
- Eurozone: Weighed down by continued energy vulnerability, the IMF lowered the euro area’s 2026 growth forecast to 0.9%, with Germany facing persistent stagflationary pressure from high industrial input costs. A partial bright spot: German exports rose unexpectedly in May 2026 on a surge in U.S. demand, a reminder that the regional picture is uneven rather than uniformly weak.
- China: China’s 2026 growth outlook was raised to 4.6% (from 4.4% in April) after a strong first quarter, with 2027 growth seen at 4.1% (up from 4.0%), helped by strong technology-manufacturing output and clean-energy exports offsetting a soft domestic property and retail sector. That said, Chinese producer-price deflation flipped sharply the other way in June, with factory-gate inflation jumping to a roughly four-year high and squeezing manufacturer margins — a sign that global input-cost pressure is spreading through supply chains.
- South Korea: Growth was revised up 0.7 percentage points to 2.6% for 2026 on strong AI hardware export demand, though this same AI-chip exposure has made South Korean markets unusually volatile in early July — see the Markets note below
- Japan: Growth was revised slightly lower to 0.6% for 2026 (down 0.1 point) on weak real-wage growth and cautious consumer spending, with 2027 nudged up to 0.7%. The Bank of Japan has separately flagged growing inflation pressure stemming from the Iran war, even as it kept its broader regional economic assessment unchanged. Japanese bond markets are flashing a related but distinct warning: the 10-year JGB yield hit a 30-year high of 2.900% on July 9 — its ninth straight day of gains, the longest streak in 19 years — driven by both the renewed Middle East-linked inflation risk and standalone concern over Japan’s own fiscal health. The 10-year/2-year JGB spread widened to 143 basis points, the highest since 2004, as the government’s large fiscal spending blueprint fuels concern it could pressure the BOJ to keep rates low even as inflation risk builds at the long end; Tokyo is reportedly considering revising the blueprint’s language on BOJ policy independence.
- India (IMF calendar-year basis): The IMF trimmed its 2026 calendar-year India growth forecast slightly to 6.4% (from 6.5% in April), while raising its 2027 forecast to 6.7% (from 6.5%)
Markets & Cross-Asset Signals
Joint agency statement (July 8): The heads of the IMF, World Bank, International Energy Agency, and World Trade Organization issued a joint statement saying the global economy had been “broadly resilient” to the Middle East war shock so far, while cautioning that uncertainty remains high and energy/trade strains could still linger. They called for progress toward reopening the Strait of Hormuz and pledged coordinated monitoring and readiness to act further.
Markets choppier than the official narrative suggests:
- HSBC dropped its “overweight” call on emerging-market equities on July 8, citing fears that a pullback in AI-related capital spending could disproportionately hit AI-exposed EM Asian markets.
- South Korea’s KOSPI fell 5.35% that day alone and is now down more than 20% from its late-June record close — bear-market territory — even after Samsung Electronics forecast a 19-fold jump in Q2 operating profit, a sign sentiment is currently more driven by AI-spending anxiety than by individual company fundamentals.
- HSBC simultaneously upgraded eurozone equities to overweight, citing lower consensus growth expectations and a weaker euro as supportive for the region over the summer.
HSBC gold price forecast cut (July 9):
- Lowered its 2026 average forecast to $4,560/oz (from $4,864) and its 2027 forecast to $4,925/oz (from $5,000), citing the more hawkish U.S. rate outlook and a stronger dollar.
- Spot gold was trading around $4,100/oz, down more than 20% from January’s record of $5,594.82.
- The bank noted downside risk from the Iran conflict specifically may prove short-lived, since structural drivers of gold demand — fiscal deficit concerns, economic uncertainty, sovereign debt burdens — remain in place.
Partial calm by July 9:
- Brent pulled back under $77/barrel after its multi-day 9% spike.
- U.S. 10-year Treasury yields steadied near 4.56%.
- European shares edged higher on a tech rebound.
- CME FedWatch pricing still showed roughly an 87% implied probability of a Fed hike sometime this year, following June’s FOMC minutes — the first released under new Chair Kevin Warsh
Inflation & Central Bank Actions
- Commodity Headwinds: The World Bank had projected an average Brent price of $89–94 per barrel for 2026 (roughly a 36% jump on early-2025 levels) on transit-risk premiums around key maritime choke points. Energy stress had eased through much of late June, with prices dipping below $80 per barrel as U.S.–Iran talks showed tentative progress.
- Latest development (July 8–9, 2026): This easing reversed abruptly. President Trump declared the mid-June ceasefire with Iran “over” after Iranian forces attacked tankers in the Strait of Hormuz, prompting fresh U.S. strikes. Brent jumped roughly 6% to above $78/barrel and WTI rose to around $74.55, the dollar firmed on safe-haven demand, and markets moved to price in a higher probability of the next Fed move being a hike rather than a cut. Equities sold off on the day while crude spiked. Gulf economies are bracing for an uneven toll depending on their exposure to shipping and energy trade through the Strait. This is a fast-moving, binary-risk situation for the H2 2026 energy and inflation outlook and is worth flagging explicitly in interviews rather than treated as resolved.
- Stalled Disinflation: Driven by energy and secondary agricultural-input pressures, the IMF raised its global headline inflation forecast for 2026 to 4.7%.
- Federal Reserve Position: Kevin Warsh took over as the 17th Chair of the Federal Reserve in May 2026. FOMC communications through mid-year have highlighted a divided policy board; with energy-price pressure now leaking into broader price indices and renewed geopolitical risk, market pricing has shifted toward the possibility that the Fed’s next move is a hike rather than a cut, a reversal from earlier-year expectations.
Indian Macroeconomic Update
Growth Dynamics & The New National Accounts Series
India remains the fastest-growing major economy, though domestic institutions are taking a defensive policy stance given external risks.
- The Methodological Shift: In early 2026, MoSPI updated the GDP base year to 2022-23 (from 2011-12), incorporating granular inputs from the MCA-21 corporate database, the Annual Survey of Unincorporated Sector Enterprises (ASUSE), the Periodic Labour Force Survey (PLFS), and GST network data
- Growth Revisions: Under the revised methodology, India’s real GDP growth for FY26 came in at 7.7% (up from 7.1% in FY25), with nominal GDP growth of 8.9%. Q4 FY26 real GDP expanded 7.8%, driven by manufacturing and construction.
- High-Frequency Industrial Indicators: The Index of Eight Core Industries grew a modest 0.5% year-on-year in May 2026, though steel and cement remained comparatively strong, pointing to continued investment-linked infrastructure activity.
- The Policy Pause: Citing West Asia-linked external risk, the RBI’s Monetary Policy Committee (MPC) at its June 2026 meeting lowered its baseline FY27 growth projection to 6.6% (from 6.9% previously).
Monetary Stance & Systemic Liquidity Support
- The Benchmark: Led by Governor Sanjay Malhotra, the RBI MPC held the repo rate steady at 5.25%, maintaining a neutral policy stance.
- Currency Volatility: The rupee’s path in H1 2026 was steeper than a simple headline suggests. It touched a record low of roughly ₹96.96/USD on May 20, 2026, before recovering about 1.5% into early July — a much sharper round trip than a simple move from the low-90s to the mid-90s. That recovery has come under renewed pressure following the collapse of the Iran ceasefire on July 8–9 A separate market signal worth noting: foreign investors have been rapidly unwinding bets that the RBI would need to hike rates to defend the currency, pushing turnover in India’s five-year interest-rate swap market to a record high in early July — a sign of returning confidence even amid the renewed geopolitical shock.
- Systemic Capital Buffers: To counter currency pressure and support market liquidity, the RBI expanded the Fully Accessible Route (FAR) for government securities to include all new issuances of 15-, 30-, and 40-year maturities, and removed FPI limits on short-term investments under the general route.
- Targeted Liquidity & Hedging Relief: The RBI extended a concessional forex swap facility until September 30, 2026 to encourage External Commercial Borrowings (ECBs) by public-sector undertakings, and committed to bearing hedging costs until late September for fresh 3–5 year FCNR(B) deposits raised through Authorised Dealers.
Specialised Macro Dimensions
1. Inflation Dynamics & Margin Pressure
- Retail CPI Tracking: India’s retail CPI inflation printed at 3.93% in May 2026. A Reuters poll of 37 economists (conducted July 3–9) puts consensus at 4.3% for June, which would mark the first breach of the RBI’s 4% medium-term target in 16 months; estimates in the poll ranged from 3.65% to 5.50%. The same poll put wholesale price (WPI) inflation at roughly 9.15% in June, only marginally down from 9.68% in May.
- The WPI vs. CPI Divergence: A widening gap between elevated wholesale inflation — driven largely by international energy costs — and comparatively subdued retail CPI has been a recurring theme through mid-2026, with pass-through from producer to retail prices remaining partial and delayed.
- Corporate Margin Squeeze: Rather than an imminent surge in consumer prices, this divergence points to margin pressure within manufacturing chains, as firms absorb upstream cost shocks to protect retail volumes
2. Fiscal Policy & Financial Stability
- Asset Quality Resilience: Per the RBI’s Financial Stability Report (FSR) released on June 30, 2026, gross non-performing assets (GNPAs) at scheduled commercial banks fell to a multi-decadal low of 1.8%.
- CASA Disintermediation: The FSR highlights an accelerating shift of retail savings out of low-yield current and savings accounts (CASA) into mutual funds and equities
- Rising Cost of Funds: Banks are leaning more on higher-cost term deposits and certificates of deposit to match liabilities, pushing up their marginal cost of funds and encouraging a defensive shift toward high-yielding small-business lending.
- Emerging AI Risks: For the first time, commercial banks and upper-layer NBFCs surveyed by the RBI ranked AI-enabled cyber threats as the single largest operational risk facing the Indian financial system over the coming year
3. Geopolitical & Trade Friction
- The US Trade Deadlock: Bilateral India-US trade negotiations remain gridlocked, with the U.S. side approaching trade as a strict balance-sheet exercise and pointing to India’s tariff levels and trade surplus as friction points.
- India’s Position: New Delhi has held firm, arguing it will not compromise the interests of domestic farmers and small businesses to speed up an agreement
- Trade Redirection via CEPAs: India is accelerating alternative trade pacts to diversify away from the slow bilateral U.S. track — the India-Oman Comprehensive Economic Partnership Agreement (CEPA) entered into force on June 1, 2026, alongside preparations ahead of a July 15, 2026 India-UK trade milestone.
Deep Dives & Structural Updates
A. The "Trump Tariff" Impact Assessment
- The Industrial Burden: A 50% U.S. tariff on labour-intensive Indian manufacturing exports — including gems and jewellery, textiles, leather goods, and chemicals — remains an active drag on order books in those sectors.
- Bilateral Redirection: Rather than retaliating in ways that risk imported inflation, New Delhi has accelerated fast-tracked FTA negotiations, intensifying trade talks with the EU, UK, Oman, and New Zealand to absorb redirected export volumes.
B. Domestic Stock Market Resiliency
FPI flows (H1 2026): Rising global yields and the West Asia energy shock drove Foreign Portfolio Investors (FPIs) to pull capital from Indian equities through much of H1 2026.
- NSDL data shows June 2026 FPI equity outflows of approximately ₹49,340 crore.
- More than offset by debt inflows of approximately ₹55,518 crore.
- A net positive FPI position of roughly ₹6,178 crore for the month, by simple arithmetic.
Debt-side turnaround drivers:
- Follows a Ministry of Finance move exempting FPIs from long-term capital gains tax on government securities and expanding tenors under the FAR route.
- Separately, global asset managers have turned more cautious on emerging-market equities generally — HSBC dropped its “overweight” call on EM equities on July 8, specifically citing AI-spending fears (see the Markets & Cross-Asset Signals section above for the South Korea/KOSPI detail).
- Useful context for why equity flows have been choppy across EM Asia even as India’s own growth story stays intact.
Retail resiliency via SIPs:
Domestic systematic investment plan (SIP) inflows have continued to anchor Indian equity indices against global volatility.
- Monthly SIP contributions printing at roughly ₹30,954 crore — comfortably above the ₹30,000 crore mark.
- Signals a maturing, more disciplined domestic retail investor base.
Insights
- The National Accounts Realignment: The shift to a 2022-23 base year has real analytical consequences — it recalibrates absolute values to better capture post-pandemic structural shifts and digitalisation. Structural savings and gross investment rates now present a cleaner picture of formalisation in the economy, visible in the FY26 growth figures
The Debt vs. Equity Dichotomy: A strong interview talking point is the divergent behaviour of foreign capital in June 2026 — broad global uncertainty drove an equity de-risking phase, while targeted sovereign fiscal reform (the LTCG exemption on bonds) flipped the debt channel into a large inflow, even as the exact net headline number needs to be confirmed against NSDL’s own release.
- The Margin Squeeze Paradox: The gap between high WPI and lower CPI outcomes does not mean consumer inflation risk has disappeared — it indicates manufacturers are absorbing cost pressure to protect volumes, a squeeze that could show up in retail prices with a lag.
- Capital vs. Social Allocation Dynamics: The latest Union Budget shows a clear tilt toward capex-led public infrastructure spending (₹12.22 lakh crore) to crowd in private investment, while welfare and rural-employment spending is being held to a tighter line to meet the 4.3% fiscal consolidation glide path. For broader budget context and analysis, see the Observer Research Foundation and SIDBI’s budget review.
- The AI vs. Energy Dichotomy: Explain global growth divergence as technology-heavy exporters (US, South Korea) structurally outperforming commodity-importing regions, because AI infrastructure demand is acting as a macro shock-absorber against high crude prices — while flagging that this framework is now being tested by the renewed Iran conflict and the resulting oil-price and rate-expectation volatility.
Key Numbers — Global
Metric / Indicator | Value / Estimate | Notes / Source & Relevance |
Global GDP Growth (IMF) | 3.0% (2026) → 3.4% (2027) | IMF WEO July Update; 2026 down from 3.1% in April; 2027 still below the 3.5% 2024-25 average. |
Global GDP Growth (World Bank) | 2.5% | World Bank GEP; slowest non-pandemic run-rate in a decade. |
Global Headline Inflation (IMF) | 4.7% (2026) → 3.9% (2027) | IMF July Update; 2026 raised 0.3pp from April. |
World Trade Growth | 3.5% (2026) → 4.3% (2027) | IMF; down from 5.0% in 2025, a tariff front-loading year |
Brent Crude — IMF working assumption | $89/bbl | IMF WEO baseline, assumes Hormuz normalises by March 2027. Actual price has been volatile: dipped under $80 in late June, jumped ~6-9% after the ceasefire collapsed July 8-9 to ~$78-80, then eased back under $77 by July 9. |
US GDP Growth | 2.3% (2026) → 2.2% (2027) | IMF; supported by AI infrastructure capex. May trade deficit widened 42.2% to $77.6bn on record capital-goods imports. |
Eurozone GDP Growth | 0.9% (2026) → 1.2% (2027) | IMF; 2026 cut from 1.1% in April on German industrial weakness; German exports beat expectations in May. |
China GDP Growth | 4.6% (2026) → 4.1% (2027) | IMF; both up from April (4.4%/4.0%); producer-price inflation hit a ~4-year high in June |
South Korea GDP Growth | 2.6% (2026) | IMF; revised up 0.7pp on AI hardware exports; KOSPI down >20% from its late-June record amid AI-spending jitters. |
Japan GDP Growth | 0.6% (2026) → 0.7% (2027) | IMF; 10-year JGB yield hit a 30-year high of 2.900% on July 9 on inflation and fiscal-health concerns |
India GDP Growth (IMF, calendar-year) | 6.4% (2026) → 6.7% (2027) | IMF Distinct from RBI’s FY27 fiscal-year forecast of 6.6% — different reference periods, not directly comparable. |
HSBC Gold Price Forecast | $4,560/oz avg (2026) → $4,925/oz avg (2027) | Cut from $4,864 / $5,000 on hawkish Fed outlook and stronger dollar; spot gold ~$4,100, down >20% from January’s $5,594.82 record. |
Key Numbers — India
Metric / Indicator | Value / Estimate | Notes / Source & Relevance |
Real GDP Growth (FY26) | 7.7% | MoSPI Provisional Estimates, new 2022-23 base |
Real GDP Growth Forecast (FY27) | 6.6% | RBI MPC June decision; lowered on West Asia drag |
Nominal GDP Growth (FY26) | 8.9% | MoSPI . |
Real GDP Value (FY26) | ₹323.12 lakh crore | MoSPI provisional estimate, new base year. |
Benchmark Repo Rate | 5.25% | RBI MPC June decision; neutral stance |
Headline Retail Inflation (CPI) | 3.93% (May, actual) | MoSPI .June: Reuters poll consensus 4.3% (forecast, not yet released as of this update; data due July 13) . |
RBI Projected CPI (FY27) | 5.1% | RBI MPC, revised up on crude oil price risk. |
Gross NPA Ratio (March 2026) | 1.8% | RBI Financial Stability Report; multi-decadal low. |
Rupee Exchange Rate | Record low ~₹96.96/USD (May 20, 2026); recovered ~1.5% by early July | Renewed pressure since the July 8–9 ceasefire collapse |
Monthly Merchandise Trade Deficit (May 2026) | $28.21 Billion | Ministry of Commerce/Asia News Network; widened on high crude and gold imports . |
FPI Equity Outflow (June 2026) | ≈ ₹49,340 crore | NSDL-sourced reporting — corrected from earlier unreconciled figures. |
FPI Debt Inflow (June 2026) | ≈ ₹55,518 crore | NSDL-sourced reporting — corrected; driven by LTCG exemption on sovereign bonds. |
Monthly SIP Inflow | ₹30,954 crore | AMFI data via Open Magazine; sustained retail discipline |
Fiscal Deficit Target (FY27) | 4.3% of GDP | Union Budget Estimates . |
Central Budgetary CapEx Outlay | ₹12.22 lakh crore | Union Budget Estimates. |
Total Budgeted Expenditure | ₹53.47 lakh crore | Union Budget Estimates. |
Key Numbers - India
Metric | Value / Estimate | Notes / Relevance |
GDP Growth (Real, India, FY24-25) | ~ 6.5% (Press Information Bureau) | Highest among large economies; sets base for business optimism. |
Nominal GDP (FY25 estimate) | ~ ₹1,87,97,000 crore (~ US$2.20 trillion) (Press Information Bureau) | Helps with scale comparisons; calculating Govt receipts / spending as % of GDP. |
Inflation / CPI | ~ 5.0% (recent) (World Bank Open Data) | RBI target band; effect on real incomes, interest rates. |
Current Account Deficit (CAD) FY25 | $23.3 billion (0.6% of GDP) during 2024-25, lower than $26 billion (0.7% of GDP) during 2023-24 $13.5 billion current account surplus in Q4FY25 (The Hindu) | Q4 surplus is driven by remittances from Indians living abroad. |
FDI Inflows | ₹4,81,663 crore in first 8 months of FY25 (~US$55.6B) (India Brand Equity Foundation) | Important for capital formation, capacity expansion. |
Forex Reserves | (Recent reports) ~US$698.3 billion (incl. gold) (The Times of India) | Gives buffer vs external shocks, stabilises currency/risk perception. |
Metric | Value | Context / Implication |
Fiscal Deficit target (FY26) | 4.4% of GDP (Press Information Bureau) | Down from the revised estimate for FY25 (~4.8%); shows focus on fiscal consolidation. |
Revenue Deficit target | 1.5% of GDP (PRS Legislative Research) | Difference between what the government spends on operations vs what it earns (excluding borrowings). Lower = better. |
Primary Deficit | 0.8% of GDP (i.e. fiscal deficit minus interest payments) (PRS Legislative Research) | Reflects borrowing excluding debt servicing; a key in assessing true borrowing pressure. |
Outstanding Liabilities (Central Govt. Debt) | ~ 56.1% of GDP in FY25-26 (PRS Legislative Research) | Shows debt burden; government also wants to bring this down to ~50% by March 2031. (Reuters) |
Gross Market Borrowings | ₹14.82 lakh crore (~ borrowings via government bonds etc.) (Press Information Bureau) | Key for bond markets, interest rates, investment flows. |
Capex (Capital Expenditure) in FY26 Budget Estimate | ₹11.21 lakh crore ≈ 3.1% of GDP (Press Information Bureau) | Emphasis on infrastructure / public investment; companies in infra, construction etc. will care. |
Revised Estimates for 2024-25 — Expenditure & Receipts | Total expenditure ~ ₹47.16 lakh crore, of which capital expenditure ~ ₹10.18 lakh crore; total non-borrowed receipts ~ ₹31.47 lakh crore, net tax receipts ~ ₹25.57 lakh crore (Press Information Bureau) | Useful to compare what was spent vs budgeted; helps assess slippages / government performance. |
Disinvestment Target | ₹47,000 crore for FY26 (lower than FY25 target) (PRS Legislative Research) | Shows how much the government plans to raise via selling stakes in PSUs; impacts sectors, investor sentiment. |
Support / Capital Spending to States | ₹3.6 lakh crore 50-year interest-free loans under “Special Assistance to States for Capital Investment (SASCI)” for capital expenditure to states. Also, ₹1.5 lakh crore outlay for long-term loans to states for infra. (India Budget) | Important for state infra development; shows centre-state fiscal relations and growth engines spread across regions. |
Sector | Sub-Sector | % Share of GDP/GVA (FY25) | Growth Rate FY25 (Real, YoY) | Workforce Share (approx) |
Primary | Agriculture, Forestry, Fishing & Livestock | ~15.6% | +4.0–4.5% | ~40% |
Mining & Quarrying | ~2.3% | +2.7% | <1% | |
Secondary | Manufacturing | ~13.5% | +4.5% | ~12% |
Electricity, Gas, Water & Other Utilities | ~2.5% | +5.9% | <1% | |
Construction | ~8.0% | +9.4% | ~12% | |
Tertiary | Trade, Hotels, Transport & Communication | ~18.0% | +6.1% | ~15% |
Financial, Real Estate & Professional Services | ~22.0% | +7.2% | ~8% | |
↳ IT/ITeS (IT–BPM) | ~7.3% (≈13% of services) | ~8–9% | ~3–4% | |
Public Administration, Defence & Other Services | ~12.0% | +8.9% | ~6% |
Sectoral Matrix — India GVA Share & Performance
Macro Sector | Sub-Sector | Est. % GVA Share (New Base) | FY26 Real Growth | Employment Footprint |
Primary | Agriculture, Forestry & Fishing | ~15.0% | +3.0% | ~40.0% of workforce |
Primary | Mining & Quarrying | ~2.1% | +2.7% | <1.0% of workforce |
Secondary | Manufacturing | ~17.5% | +10.7% | ~12.0% of workforce |
Secondary | Construction & Infrastructure | ~8.5% | +8.2% (GFCF proxy) | ~12.0% of workforce |
Secondary | Electricity & Water Utilities | ~2.4% | +5.9% | <1.0% of workforce |
Tertiary | Trade, Hospitality, Transport & Comms. | ~17.2% | +11.0% | ~15.0% of workforce |
Tertiary | Financial, Real Estate & Professional Svcs. | ~21.4% | +7.2% | ~8.0% of workforce |
Tertiary | IT / Business Process Management | ~6.8% | +8.5% | ~3.5% of workforce |
Tertiary | Public Admin., Defence & Other Services | ~11.5% | +8.9% | ~6.0% of workforce |
Source: MoSPI provisional GVA estimates.
Source List
- Reuters – IMF lowers 2026 global growth forecast to 3%, sees rebound in 2027
- World Bank – Global Economic Prospects, June 2026 (press release)
- Reuters – US May trade deficit widens as capital goods imports hit record high
- Reuters – German exports rise unexpectedly in May on surge in US demand
- Reuters – China’s producer inflation jumps to 4-year high, squeezing manufacturers
- Reuters – Bank of Japan sees growing inflation pressures from Iran war
- Department of Economic Affairs, Ministry of Finance – Monthly Economic Review, June 2026
- Reuters – Dollar stands tall as new Gulf attacks fuel oil price surge, Fed hike bets
- Reuters – Trading Day: War on, risk-off — stocks drop, crude jumps
- Reuters – Oil prices fall as markets weigh impact of US strikes on Iran
- Reuters – Gulf companies are set to reveal the unequal toll of Iran war
- Federal Reserve Board – Kevin Warsh, Chairman (official biography)
- MoSPI, Government of India – Press Note on New Series of GDP Estimates with Base Year 2022-23
- MoSPI, Government of India – Gross Domestic Product Provisional Estimates, FY26
- RBI MPC June 2026 Resolutions: Repo Rate Held at 5.25% – Business Standard
- Foreign investors pare India rate-hike bets, fuel record 5-year swaps trading – Reuters / Business Standard
- MoSPI, Government of India – Consumer Price Index Press Release, May 2026
- Reuters – India consumer inflation likely topped RBI’s 4% target in June (poll)
- India: Gradual firming CPI supports RBI patience – Société Générale, via FXStreet
- Reserve Bank of India Releases Financial Stability Report, June 2026 – Business Today
- India-US trade deal: Why the much-awaited agreement remains stuck – Outlook India
- FPI equity/debt flow data (NSDL-sourced) – Business Today
- Equity MFs Extend 63-month Inflow Streak As SIP Contributions Stay Above Rs 30,000 Crore – Open Magazine (AMFI data)
- SIP Stability or Stagnation: What the 2026 AMFI Data Actually Shows – Finnovate
- Union Budget 2026 lowers fiscal deficit target for FY27 to 4.3% – Business Standard
- India’s Trade Deficit Recorded at $28.21 Billion, Exports Grow 18% – Asia News Network
- Press Information Bureau, Ministry of Commerce & Industry – India’s May Trade Deficit Narrows Slightly as Exports Gain
- Union Budget 2026-27: Spending and Development Priorities – ORF (Observer Research Foundation)
- Union Budget 2026-27 – SIDBI Analysis
- Reuters – Japan benchmark bond yield extends rise after hitting 30-year high
- Reuters – HSBC drops ‘overweight’ call on EM equities on AI spending fears
- Reuters – HSBC lowers 2026-27 gold price forecasts on hawkish Fed tilt
- Reuters – Global economy resilient to Middle East war shock, agencies say
- Reuters – Global markets wrap: Europe steadies after fresh Middle East hostilities
Get More Insights

Mastering Risk Management: A Guide for MBA Students and Professionals
A practical guide to mastering risk management for MBA students and professionals in business and finance.
Read More
Leveraging Structured Thinking in Career Transitions
Use structured thinking to navigate career transitions with clarity, confidence, and actionable steps.
Read MoreQUICK LINKS
- Home
- About
- Career Conversations
- Resume Reviews
- Mock Interviews
POLICIES
- Terms & Conditions
- Privacy Policy
- Refund Policy
CONTACT
- +91-81485-89887
- support@gocrackit.com
- #518, Ground Floor, 10th Cross, Mico Layout, BTM 2nd Stage, Bangalore - 560076